MAP
Parameters and functions
Beta command
This command is in the beta stage and the format may change over time.
*MAP
"Optional title"
coid, $n_1$, $n_2$, $n_3$
$x_1$, ..., $x_8$
.
$x_M$, ..., $x_N$
"Optional title"
coid, $n_1$, $n_2$, $n_3$
$x_1$, ..., $x_8$
.
$x_M$, ..., $x_N$
Parameter definition
Variable
Description
coid
Command ID
$n_1$
Number of data points in direction 1 (rows if $n_3 = 0$)
$n_2$
Number of data points in direction 2 (columns if $n_3 = 0$)
$n_3$
Number of data points in direction 3 (optional)
$x_1$, ..., $x_8$
Data points 1 to 8
.
$x_M$, ..., $x_N$
Data points $M$ to $N = n_1 \times n_2 \times n_3$
Description
This command defines a cartesian map of $n_1 \times n_2 \times n_3$ data points. The data points are to be listed in a row-wise consecutive order.
Example
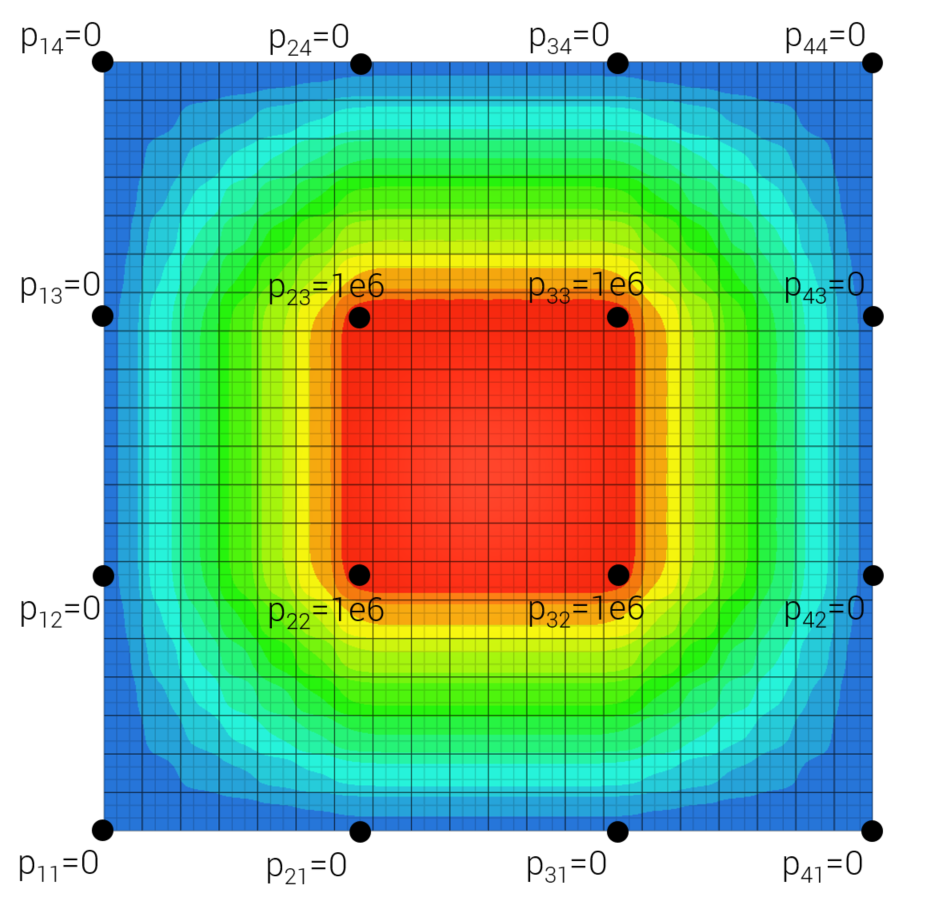
Pressure loaded panel
An example using MAP to define a pressure load on a plate. The three arguments to map() in the FUNCTION with ID 100 are the MAP ID, the parametric location in the row direction (between 0 and 1) and the parametric location in the column direction.
*UNIT_SYSTEM
SI
*PARAMETER
L = 1.0
t = 0.003
p = 1.0e6
*COMPONENT_BOX
1, 1, 20, 20, 1
0, 0, 0, [%L], [%L], [%t]
*CHANGE_P-ORDER
ALL, 0, 3
*MAT_ELASTIC
1, 7800.0, 210.0e9, 0.3
*PART
"plate"
1, 1
*LOAD_PRESSURE
G, 1, 100
*GEOMETRY_SEED_COORDINATE
1
[%L/2], [%L/2], [%t]
*FUNCTION
100
map(20, x/%L, y/%L)
*MAP
20, 4, 4
0, 0, 0, 0, 0, [%p], [%p], 0
0, [%p], [%p], 0, 0, 0, 0, 0
*END