Verification - HIII Dummy
Introduction
This document demonstrates that the Hybrid III model (male, 50th percentile) available in IMPETUS meets the requirements stated in SAE-J2856 [1] and the European directive 96/79/EC [2].
Nine different tests are investigated, as seen in the Table below. Test description and targets are taken from SAE-J2856 and the European directive 96/79/EC. Plots presented in this document has been filtered in accordance to SAE J211-3 [3].

Version control
The tests presented in this document are subjected to version control, meaning that the tests are run and evaluated prior to release of a new solver. This document is updated in conjunction with official releases of the software.
Verification - HIII dummy
Head drop test
Description:
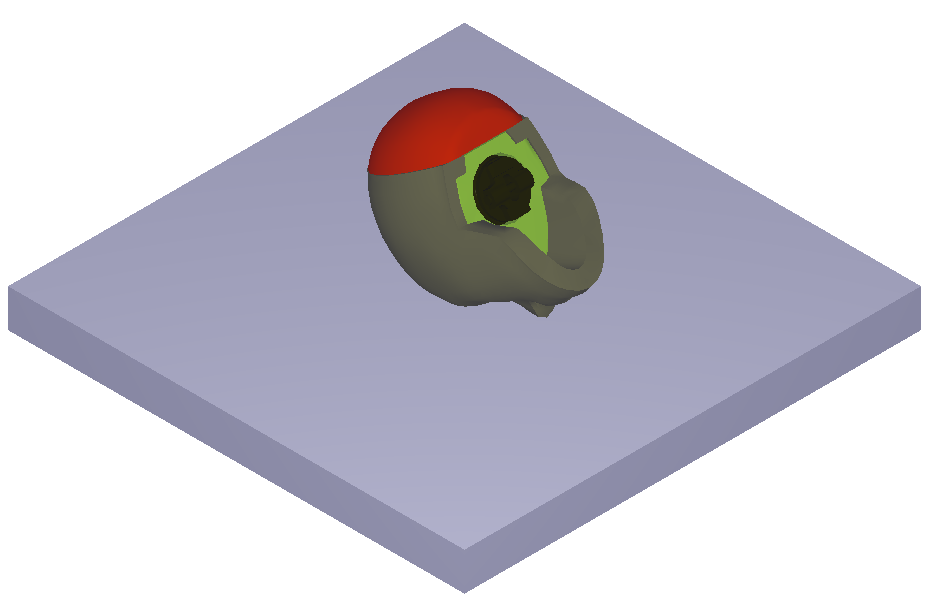
- The head assembly is dropped from a height of 376 mm onto a hard surface (assumed rigid).
-
Test description and targets from SAE-J2856J.
Targets:
- The peak resultant acceleration should be in the range of 225 - 275 $g$ ( 2207.3 - 2697.8 $m/s^2$).
- Oscillations occuring after main acceleration pulse shall be less that 10\% (zero to peak) of the main pulse.
-
Lateral acceleration should not exceed 15 $g$ (147.2 $m/s^2$).
Version control checks:
- Maximum and average resultant and lateral accelerations.
The test setup is presented in Figure 1. Resultant and lateral accelerations vs. time with targets are displayed in Figure 2 and 3 respectively.


Neck flexion test
Description:
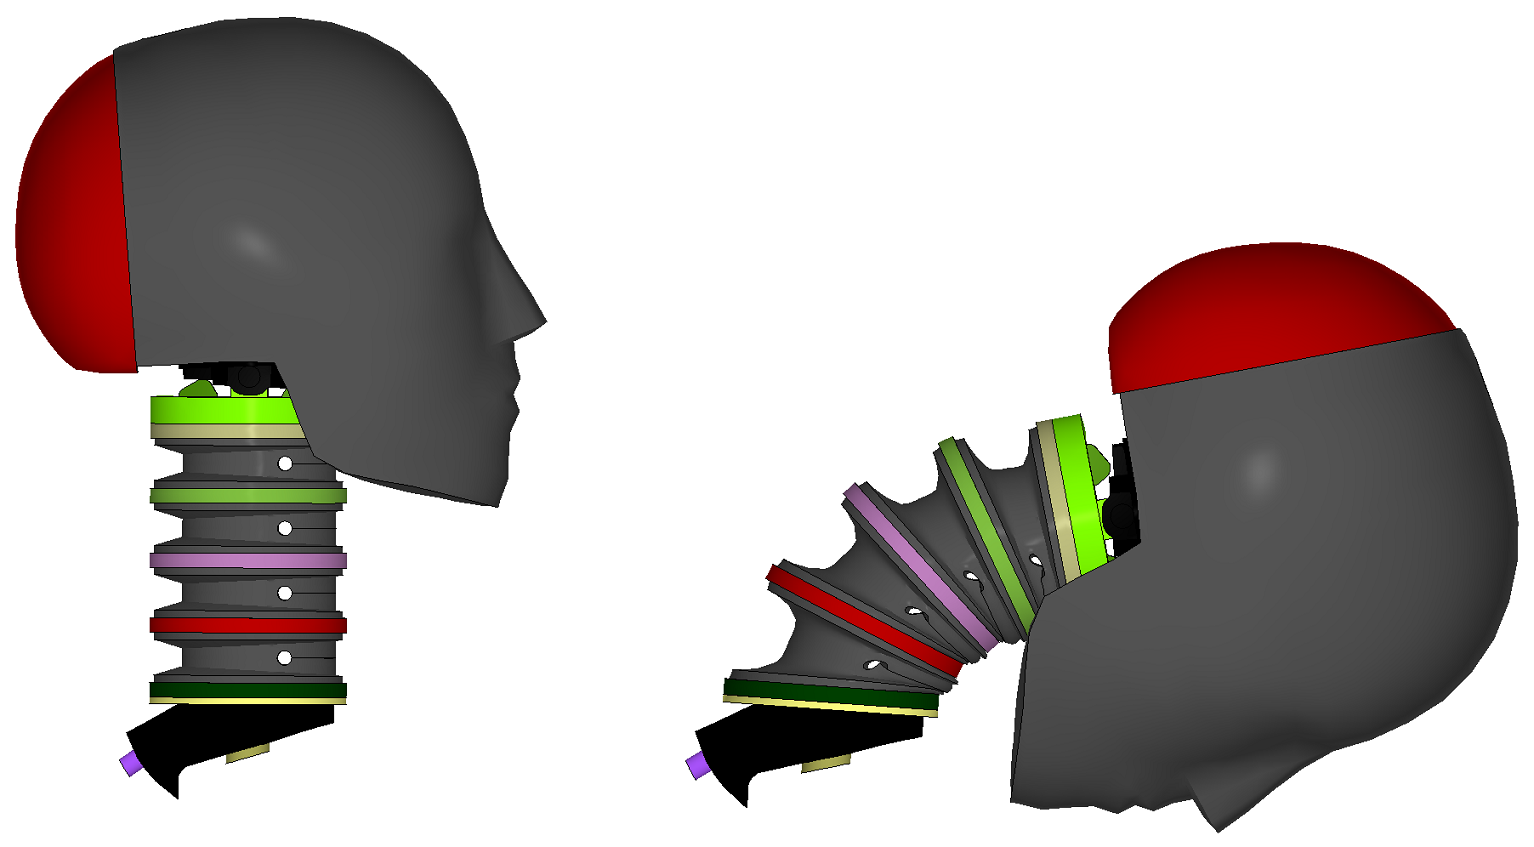
- The head and neck assembly is mounted on a pendulum and the assembly reaches a velocity between 6.89 - 7.13 $m/s$ before deaccelerated in accordance to the SAE-J2856J.
-
Test description and targets from SAE-J2856J.
Targets:
- Maximum rotation of the D-plane (horizontal plane defined through the base of the scull) should be in the range of 64-78$^\circ$ within the time interval 57 - 64 $ms$.
- The rotation should cross the zero angle at a time between 113 - 128 $ms$.
- Maximum moment should be in the range 88.1 -108.4 $Nm$ within the time interval 47 - 58 $ms$.
-
The decaying moment should first cross zero between 97 - 107 $ms$ after time zero.
Version control checks:
- Maximum, minimum and average torque and rotation.
The model at initiation and at maximum rotation is displayed in Figure 4. Torque and rotation vs. time extracted from the model together with targets are presented in Figure 5 and 6 respectively.


Neck extension test
Description:
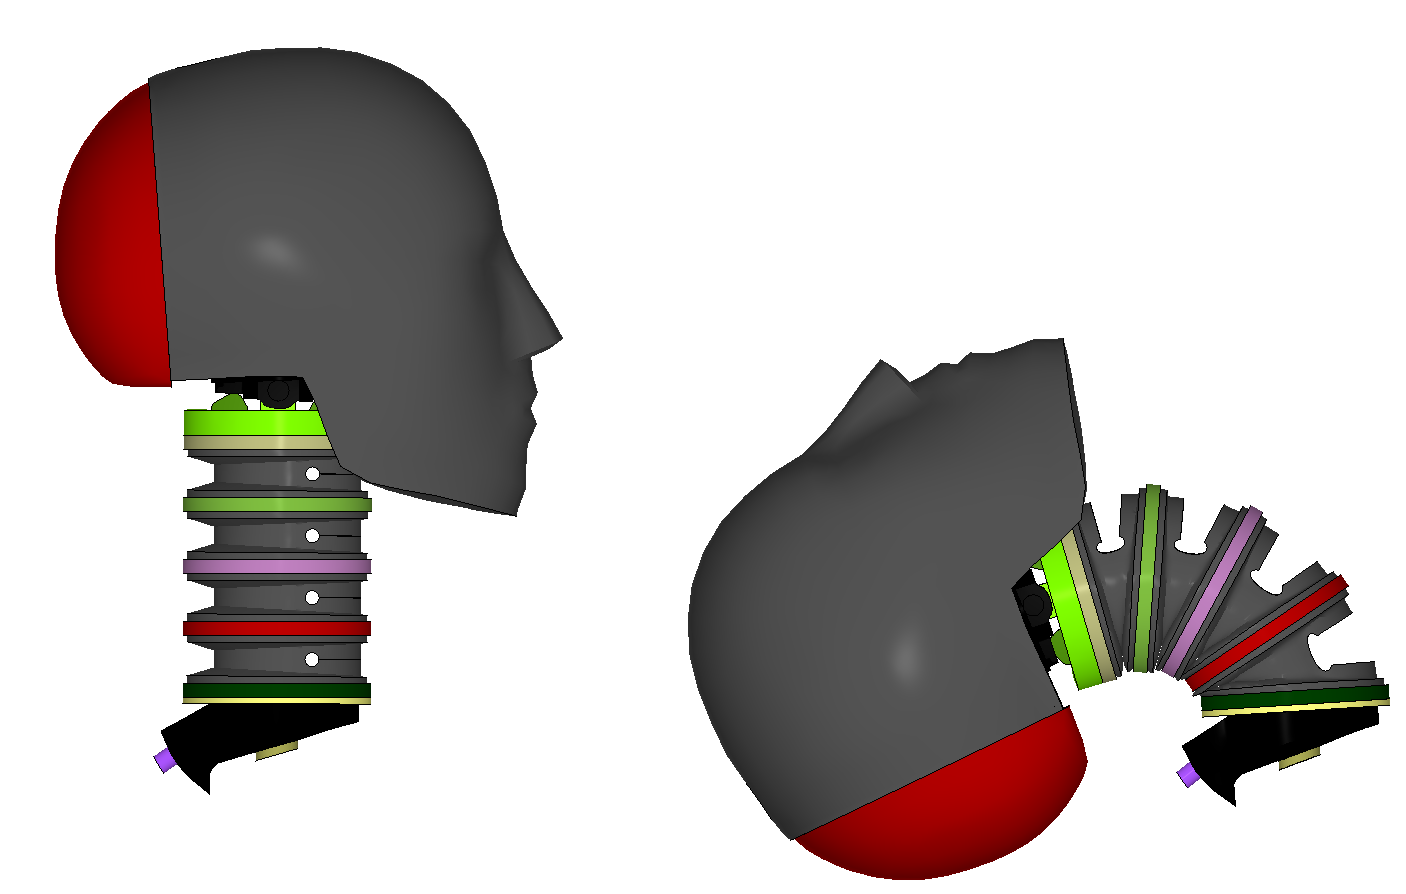
- Same procedure as in the neck flexion test but the assembly (head and neck) is turned 180 degrees.
-
Test description and targets from SAE-J2856J.
Targets:
- Maximum rotation of the D-plane (horizontal plane defined through the base of the scull) should be in the range of 81 - 106$^\circ$ within the time interval 72 - 82 $ms$.
- The rotation should cross the zero angle at a time between 147 - 174 $ms$.
- Maximum moment should be in the range of 52.9 - 80.0 $Nm$ within the time interval 65 - 79 $ms$.
-
The decaying moment should first cross zero between 120 - 148 $ms$ after the peak moment.
Version control checks:
- Maximum, minimum and average torque and rotation.
The model at initiation and at maximum rotation is displayed in Figure 7. Torque and rotation vs. time extracted from the model together with targets are presented in Figure 8 and 9 respectively.


Thorax impact test
Description:
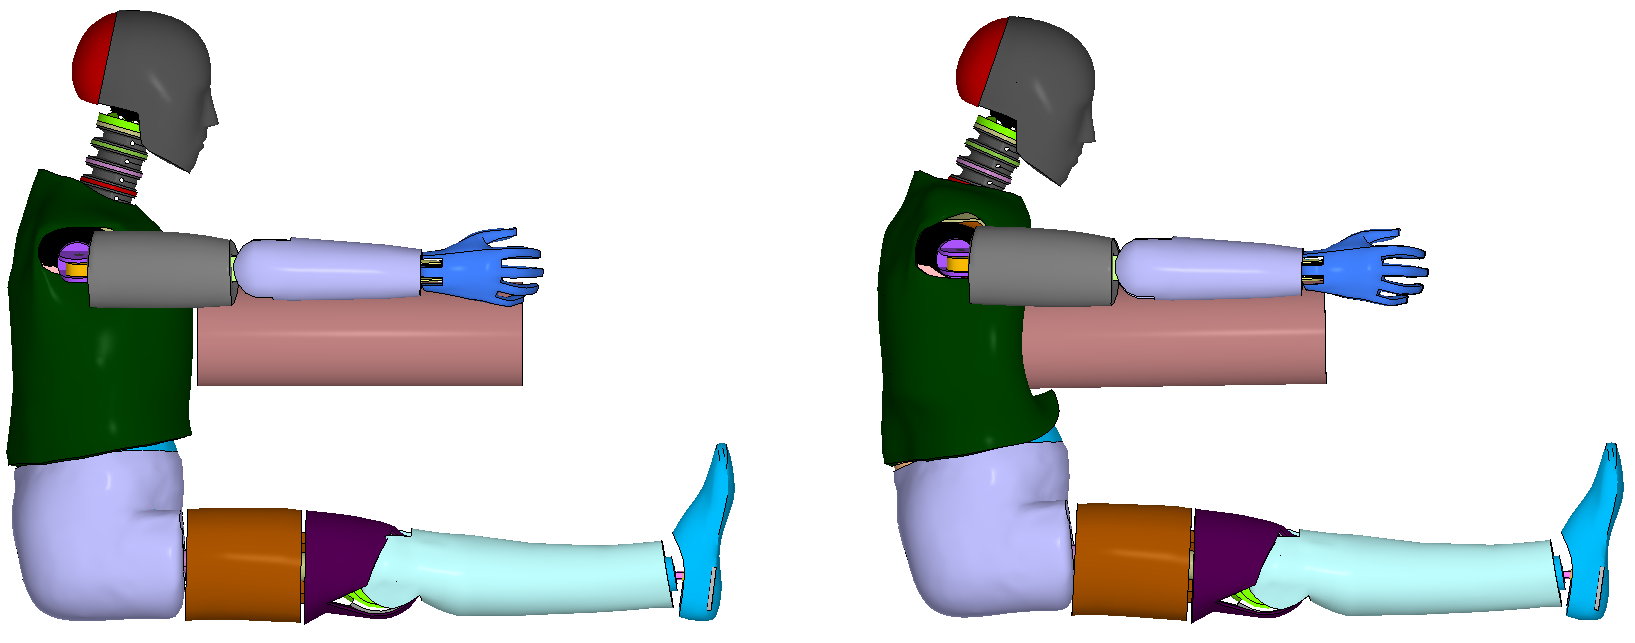
- The dummy is seated on a horizontal smooth steel surface and no external supports are used.
- A 23.35 $kg$ cylindrically shaped (D = 152.4 $mm$) test probe impacts the chest with a velocity of 6.71 $m/s$.
-
Test description and targets from SAE-J2856J.
Targets:
- Maximum sternum-to-spine deflection, measured by a chest displacement transducer should be between 63.5 - 72.6 $mm$.
-
Maximum force applied by the test probe should be between 5160 - 5894 $N$.
Version control checks:
- Maximum and average sternum-to-spine deflection and force.
The model at initiation and at maximum sternum-to-spine deflection is presented in Figure10. The sternum-to-spine deflection vs. time from the simulation is presented together with targets in Figure 11. The force applied by the probe vs. time is displayed in Figure 12.


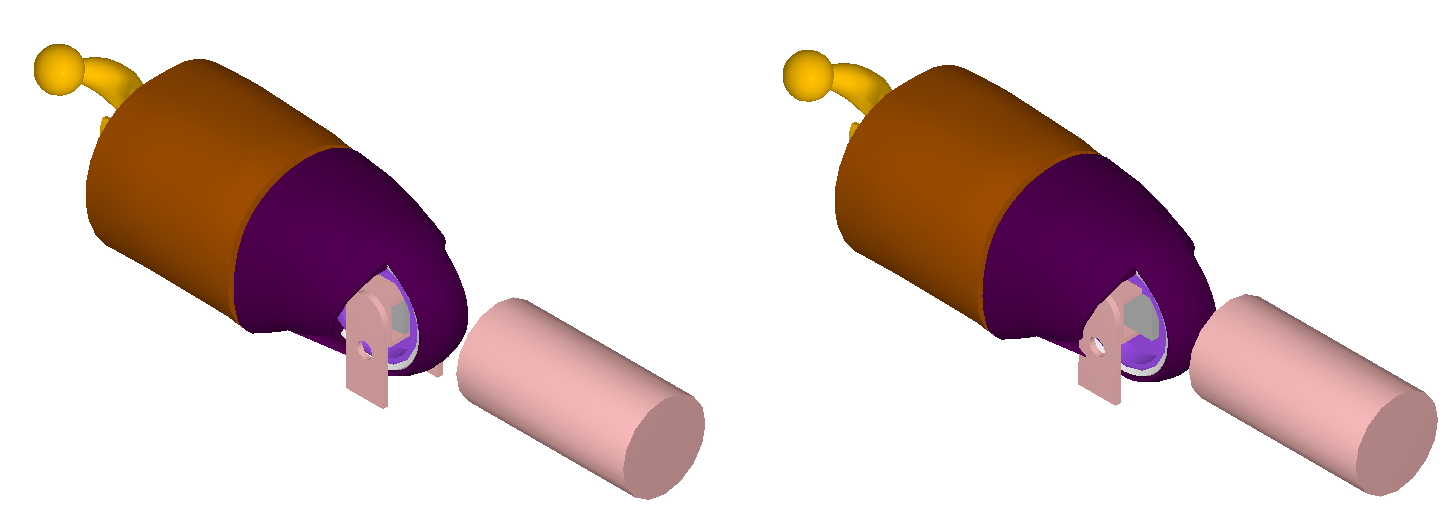
Knee impact test
Description:
- The knee and lower leg assembly is fixed to a horizontal femur load cell.
- A cylindrically shaped probe (m = 5 $kg$, D = 76.2 $mm$) impacts the knee with a velocity of 2.1 $m/s$.
- The angle between the load cell and the line defined between the knee and ankle pivots should be 66$^\circ$.
- The foot is not in contact with any exterior surface.
-
Test description and targets from SAE-J2856J.
Targets:
-
Peak impact force should be between 4715 - 5782 $N$.
Version control checks:
-
Maximum and average force.
The test setup is displayed in Figure 13. The impact force vs. time extracted from the simulation together with targets are presented in Figure 14.

Knee slider test
Description:
- The components included in this test are the knee assembly, a displacement transducer and a femur load cell.
- The load cell is fixed and q test probe (m = 12 $kg$, D = 76.2 $mm$) impacts the assembly with a velocity of 2.75 $m/s$.
- A load distribution bracket is attached to the knee slider to transmit the energy from the test probe to the knee slider.
-
Test description and targets described in SAE-J2856J.
Targets:
- The force from the femur load cell vs. the displacement of the knee slider should be within the following limits:


Version control checks:
- Maximum and average force.
The initial and final state of the simulation is presented in Figure 15. The force from the load cell vs. displacement of the knee slider is displayed in Figure 16 together with the targets.

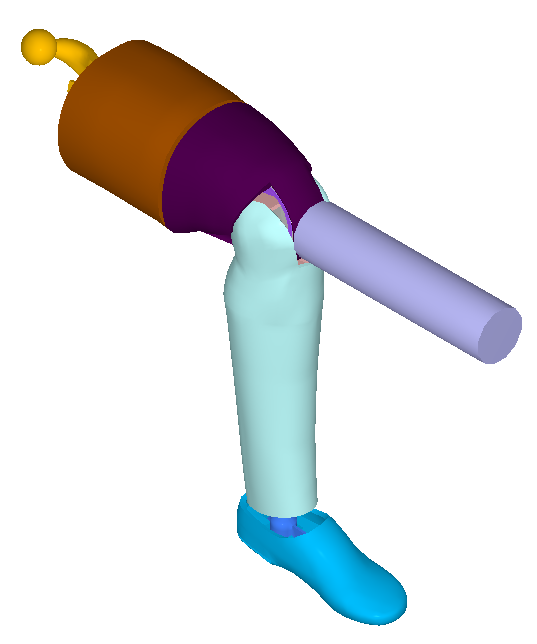
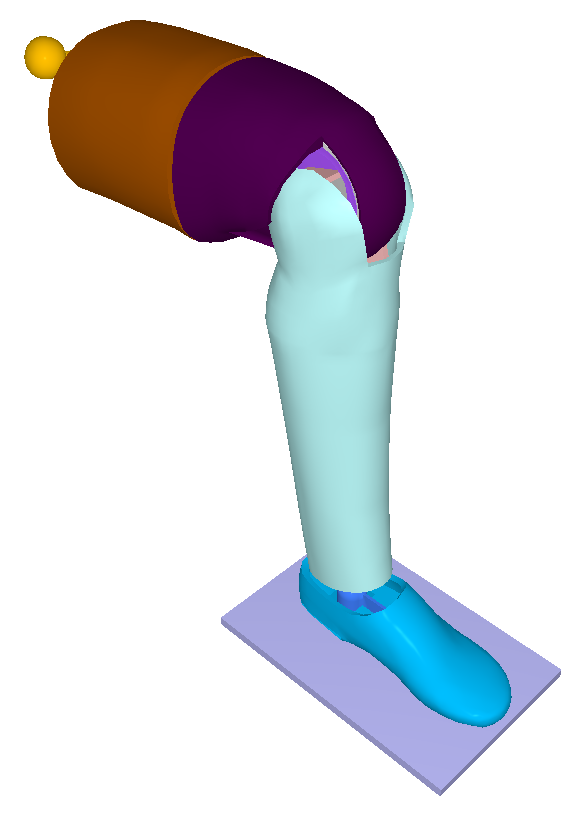
Upper foot impact test
Description:
- The leg assembly is mounted to a fixture with the upper leg and foot aligned horizontally and the lower leg aligned vertically.
- A pendulum consisting of a cylindrically shaped impactor (m = 1.25 $kg$, D = 50 $mm$) and a pendulum support arm (m = 285 $g$, D = 19 $mm$) impacts the bottom of the foot (d = 185 $mm$ from the base of the heel) with a velocity of 6.7 $m/s$.
-
Test description and targets from the European directive 96/79/EC.
Targets:
-
The maximum tibia bedning moment should be in the range of 100 - 140 $Nm$.
Version control checks:
-
Maximum and average bending moment.
The test setup is displayed in Figure 17. The moment vs. deflection from the simulation is presented in Figure 18 together with targets.
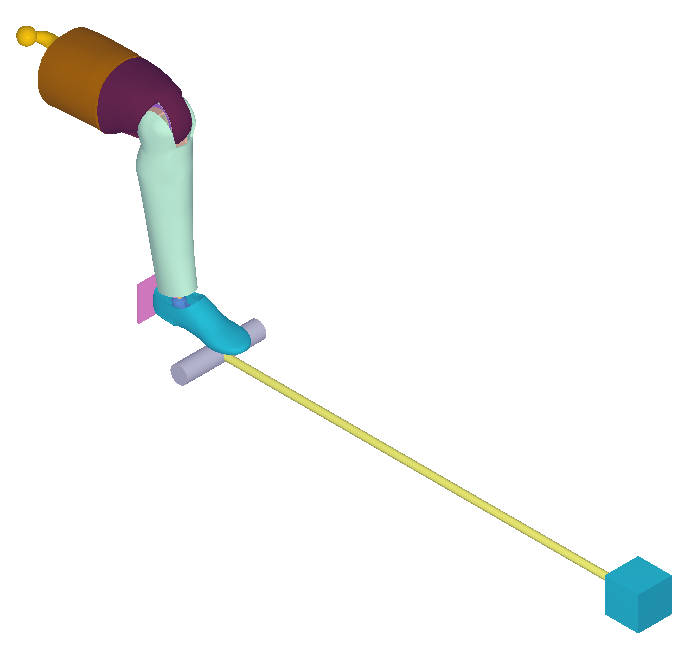

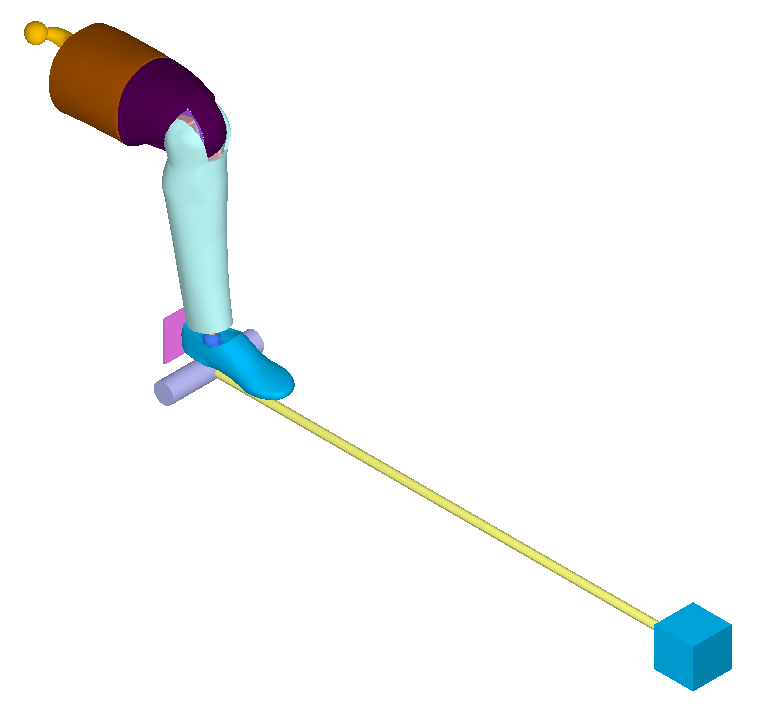
Lower foot impact test
Description:
- This test is similar to the upper foot impact test with the difference being that the impact occurs at a distance of 62 $mm$ from the base of the heel with a velocity 4.4 $m/s$.
-
Test description and targets from the European directive 96/79/EC.
Targets:
-
The maximum impactor acceleration should be in the range of 245 - 345 $g$ (2403.5 - 3384.5 $m/s^2$).
Version control checks:
-
Maximum and average impactor acceleration.
The test setup is displayed in Figure 19. The impactor acceleration vs. time from the simulation is presented together with targets in Figure 20.

Foot compression test
Description:
- The foot assembly is fixed to a compression testing machine.
- The foot is pressed against a heel pad with a rate of 15 mm/min until the deflection reaches 8.9 $mm$.
- Time zero is defined when the loading force reaches 4.45 $N$. The displacement is considered to be zero at this time.
-
Test description and targets from SAE-J2856J.
Targets:
-
The force vs. displacement curve should be in between the curves defined as follows:


Version control checks:
- Maximum and average force.
The test setup is displayed in Figure 21. The impact force vs. deflection from the simulation is presented in Figure 22 together with targets.

References
1 - User's Manual for the 50th Percentile Male Hybrid III Dummy, SAE international, SAE J2856, 2009.
2 - Directive 96/79/EC of the European parliament and of the council of 16 December 1996 - On the protection of occupants of motor vehicles in the event of a frontal impact which amend directive 80/156/EEC.
3 - Instrumentation for Impact Test, Part 1, Electronic Instrumentation, SAE J211-1, 1995.
Tests
This benchmark is associated with 9 tests.